
Semantic web · Compliance · Article 3 · Draft
Compliance as a graph, not a spreadsheet
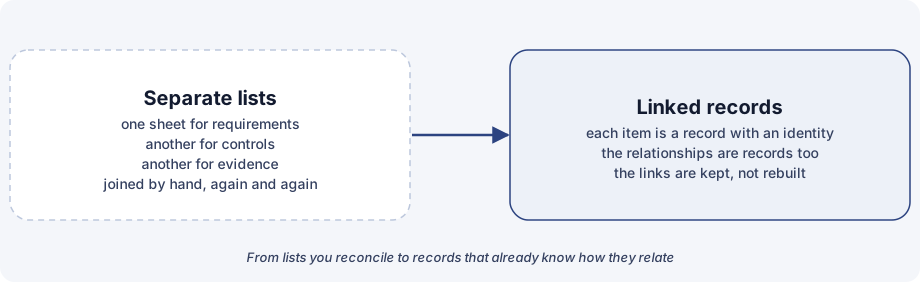
Ask a compliance team how a requirement is met and you often get a tour of spreadsheets. One sheet lists the requirements. Another lists the controls. A third holds the evidence, a fourth the risks, and the audit findings live in a report. The answer exists, but someone has to join the sheets by hand, and the next person will do it again.
The idea behind the semantic web offers a different way to hold the same information.
The idea in plain terms
The semantic web idea is to publish data as linked, machine-readable statements: this thing is related to that thing in this way. Each thing has an identity of its own, and the relationships are part of the data, not something a reader has to infer. A collection of such statements is a knowledge graph.
For governance, risk and compliance this means a small change of habit. A requirement, a control, a piece of evidence, a risk and an audit finding stop being rows in different lists. Each becomes a record with an identity, and the links between them become records too.
What a control looks like in a graph
Take a control. It satisfies a requirement. It mitigates a risk. It is supported by evidence. It was tested in an audit, and the test produced a finding. In a graph each of those statements is a link from the control to another record, and each link says who made it, when, and on what basis.
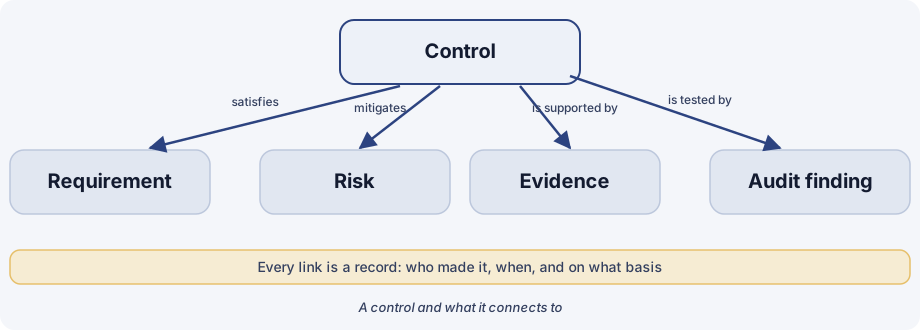
Nothing exotic is needed to see the benefit. The question "how is this requirement met, and how do we know?" becomes a walk along the links, not a tour of sheets.
What that makes possible
Traceability. From a requirement you can follow the links to the control, the evidence and the last test, and back from a finding to the control it concerns. The trail is the data itself.
Mapping across frameworks. Requirements from different frameworks often ask for much the same thing. In a graph you write the control once and link it to every requirement it answers, so one record serves several sources and a gap shows up as a requirement with no control behind it.
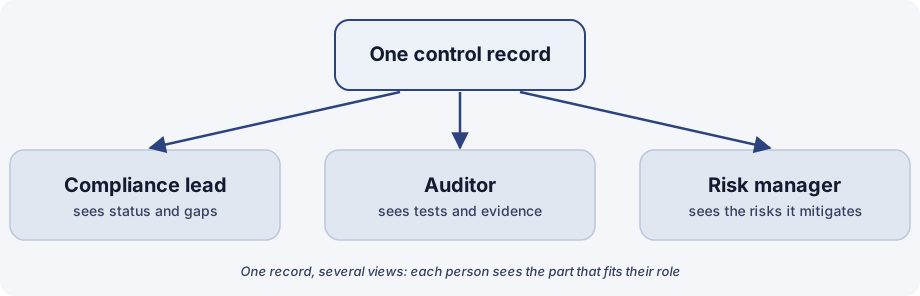
One record, several views. Because the facts are held once, each person can be shown the part that fits their role: the compliance lead sees status and gaps, the auditor sees tests and evidence, the risk manager sees the risks the control mitigates. Nobody keeps a private copy.
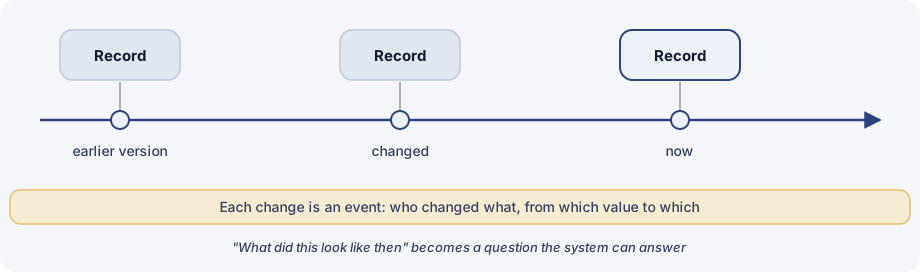
"What did this look like then". Time is part of the model in two ways. A record keeps dated versions, and every change is also recorded as an event: who changed what, from which value to which. Together they let the past state of a record be read back, so questions that auditors ask about a point in time stop being archaeology.
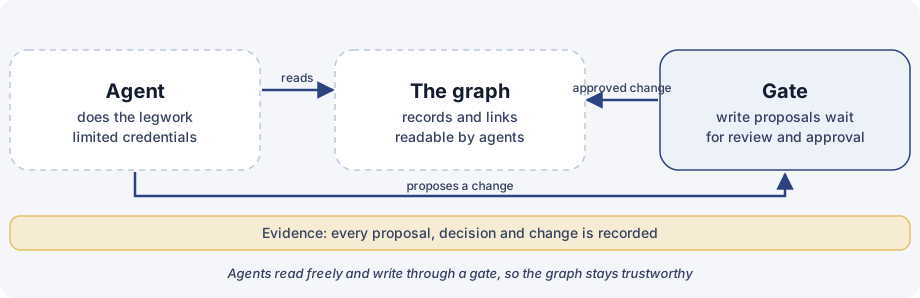
A place where agents can read and write, with gates. A graph is something software agents can read directly, because the structure is explicit. Writing is a different matter. In the same spirit as the controls from the first article of this series, an agent reads freely but proposes changes through a gate: review, owner approval and a record of the decision. The graph stays trustworthy because what enters it was approved and is traceable.
Where a graph loses to a spreadsheet
A graph is not free, and it is not always the better tool. Four honest costs:
- Maintenance. Links have to be created and kept current. A spreadsheet row can be fixed in a minute; a relationship has to be fixed everywhere it is used.
- A stale link is worse than a stale row. A stale row looks stale. A stale link looks like a fact, and every question that walks along it inherits the error with confidence. Links need a source, a date and a way to be marked superseded.
- Upkeep of the model. A shared vocabulary of record kinds and link types only helps while someone owns it. Without an owner it drifts, or it grows until nobody maintains it.
- Data quality. A graph makes poor data more visible, not better. Duplicate records, free-text names and missing identifiers turn into broken or doubled links.
For a small, stable question answered by one team, a spreadsheet is faster and cheaper. A graph earns its cost when the same facts are read by many people and many tools, when relationships matter more than rows, and when history has to be answerable.
Why it fits this field in particular
Governance, risk and compliance is a field about relationships: what is required, what is done about it, what shows it was done, what could still go wrong, and what an independent reviewer found. Spreadsheets hold the things and leave the relationships to people. A graph holds both, and so the work moves from reconciling to reading.
It also fits the argument of this series. Hard controls for agents and compliance that can be automated both depend on the same thing: explicit, linked, recorded facts that a person or an agent can follow and check.
Take away
Keep the requirement, the control, the evidence, the risk and the finding as linked records, record every change as an event, and let agents read freely and write only through a gate. Traceability, history and mapping then come from the structure, not from effort.